
Editor’s Note: Social Skills is a bi-monthly feature in RISMedia’s Daily News focused on social media and digital marketing tips, trends and solutions for agents and brokers.
Social media success in real estate is strategic—and over time, the winning formulas have become clear. The biggest aspect of social media marketing, and the one that people can find the hardest to work out, is the content. In order to successfully market on social media, you have to produce varying types of content to keep your feed fresh and engaging for followers and potential clients.
There are a couple different types of content to focus on when curating a social media account in the real estate sphere: visual, infographics and personal. Visual content is something we’ve covered before, but this time around we’re diving into infographics.
You may be asking: why should I be using infographics? I work in real estate, isn’t visual content about houses and client success enough? The answer: not necessarily.
While visual content will probably be the largest part of what you’re posting to your socials, infographics and informational content is also an important part of having a successful real estate social media strategy.
A big part of being an agent is education and information. You are constantly educating and informing your clients on the process of a transaction, the state of the market and what being a homeowner entails (taxes, insurance and more).
So many clients you work with will have little to no understanding of how real estate works, and it’s your job to break it down for them. They know this, and that’s why clients seek out agents they feel are knowledgeable and trustworthy.
This is where infographics can really help you out—they will help to demonstrate your knowledge, understanding and expertise to potential clients, proving that you’re trustworthy while also starting that education process with them a little early. Plus, strong visual elements increase the chances that people will want to click and learn more about you and your content.
Here are some ways you can incorporate infographics into your social media:
Covering market updates
As mentioned above, your clients will often have little to no understanding of real estate, specifically the inner workings of the housing market. Breaking down housing market trends and data is something you may often have to do in order to get your clients to understand certain aspects of their own transaction.
Posting infographics breaking down updates in the housing market is a great way to start showcasing your grasp on your field. It shows you keep up to date on the news, and can advise your clients with current situations in mind.
First and foremost, you’re going to want to break down moving trends (migration), sales and price data, because those are going to be the most frequent questions people will have.
From there you can take a couple different lenses. You can post weekly, coupled with larger monthly updates and even more in-depth seasonal updates (since the market does specifically vary seasonally). In these updates, you can break it down locally (town or county) for that hyperlocal angle, and then you can branch out statewide and across the whole country.
Bonus—if you do international work, break down some stats across different countries you work in as well for the added flair.

Sharing buying or selling tips
The crux of your most client interactions, save for some other real estate deals like rentals and such, will be about buying and selling.
These deals are more often than not the biggest transactions people will ever have in their lives, so they are going to be nervous. A client wants their nerves to be eased by the agent they pick, so they will often test you with many questions when you first meet to see how good your advice and knowledge are.
Showcasing the advice and expertise you have in the buying and selling process will definitely help lean more clients your way, as they won’t have to test you to know you’ll guide them smoothly and confidently, they’ll know before your first appointment.
For these types of infographics there’s a lot of knowledge you can incorporate and so many different angles to take.
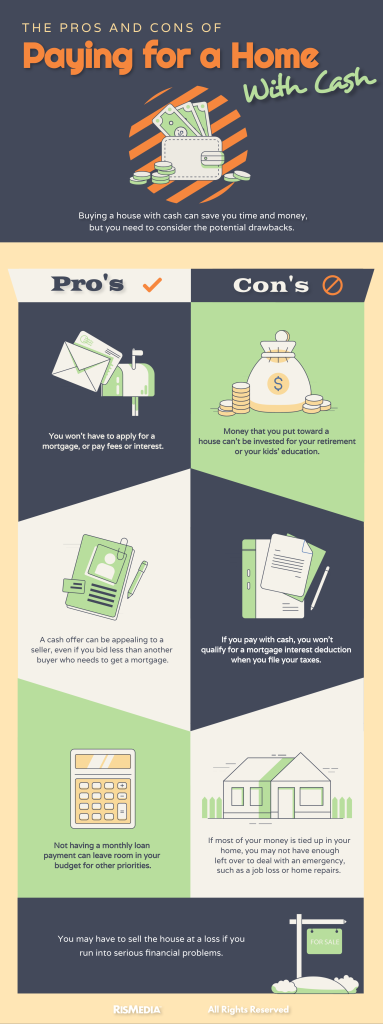
On the buying side you can break down how much capital a buyer may need to save and how they can start saving, deciding between all cash offers and getting a mortgage, the process of getting loans and where to look, and more.
On the selling side, you can break down doing renovations vs. selling as-is, how home appraisals work and the best ways to go about them, different seller concessions and what ones sellers should most consider using and more.
Are you looking to boost your online presence, enhance your content and grow your real estate business? RISMedia’s ACESocial is truly simple content marketing proven to highlight your expertise, increase engagement, generate leads and build brand awareness—all in one place. To learn more or sign up today, visit acesocial.rismedia.com.